The dashboard.
Sales, guest counts, the schedule board and live door activity.
The dashboard is the first thing you see after signing in. It answers one question: what is happening across everything my team is running?
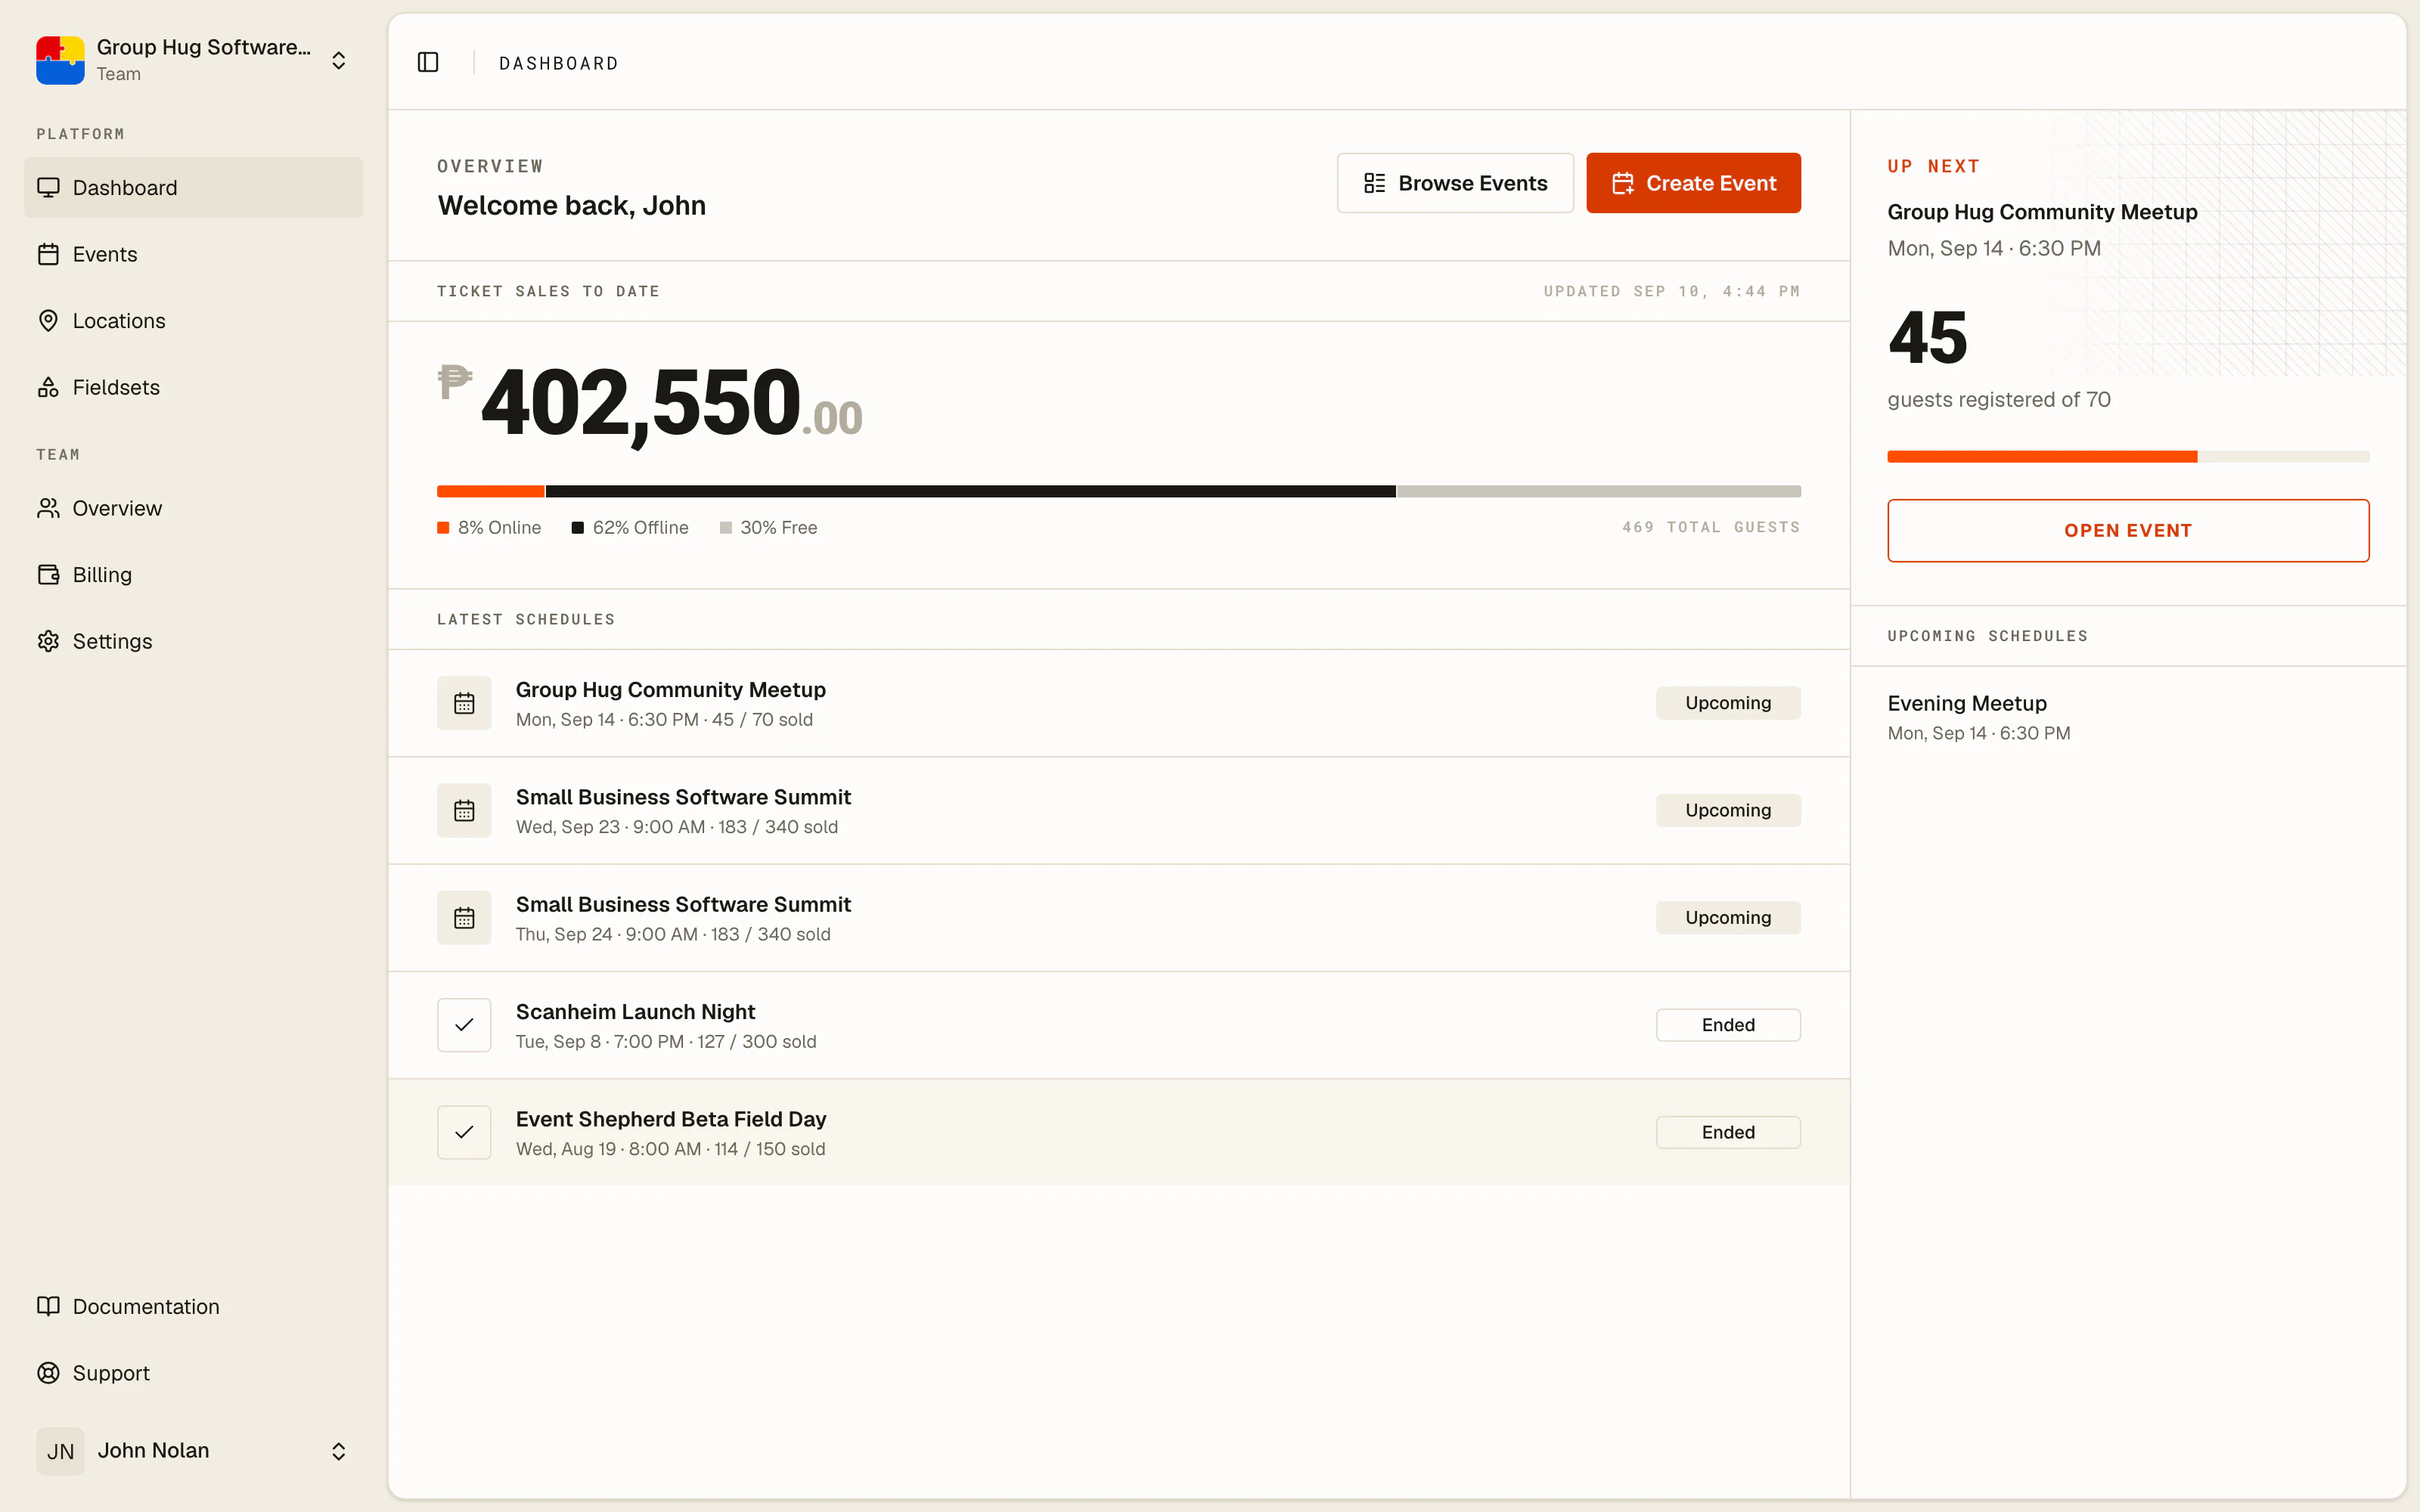
Ticket sales to date
Money taken across the team, counting paid tickets only. Free registrations do not move this number, which is deliberate: it is a revenue figure, not a popularity figure.
Everything here is in your team's billing currency, because every ticket your team sells is priced in it.
Total guests
Everyone on every guest list your team owns, however they arrived. Registered, imported and walk-up guests all count the same here.
The schedule board
Every upcoming session across every event, in date order, so the next thing you have to run is always visible without opening an event.
A session shows up here once it has a date. If the board is empty, either nothing is scheduled or your schedules have no dates on them yet.
Door activity
Live check-in traffic. During an event this is the fastest way to confirm that the door is working: scans appearing here mean the scanner is reaching the server and attendance is being recorded.
An empty feed outside event hours is normal. An empty feed while a door is scanning means the scanning devices have lost their connection, and their scans are queueing locally until it comes back. See scanning offline for what happens then.
Where to go from here
The dashboard is a summary, not a workspace. When you need detail:
- The event overview has the charts and the recap for one event.
- The live door feed shows scan-by-scan activity while an event runs.
- Exports get the underlying numbers out as files.
Last reviewed September 10, 2026